Formattable - color data according to RSD
Formattable is a powerful R library used to format tables. There are many built-in functions which allow a user to style tables using color, bars ad icons. In addition you can create your own custom formatters. Below is an example of how to color a data frame using information from a second data frame. Average values are colored red if the RSD is greater than 0.15 and green if it is below.
This was developed in order to represent a large table of data color-coded accordng to RSD so that the analyst could quickly identify potential sources of systematic error.
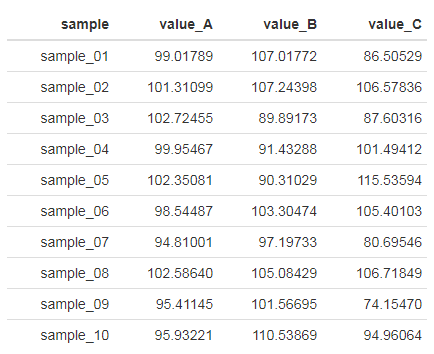
table of data
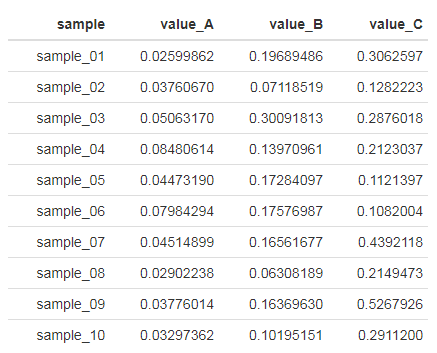
table of RSDs
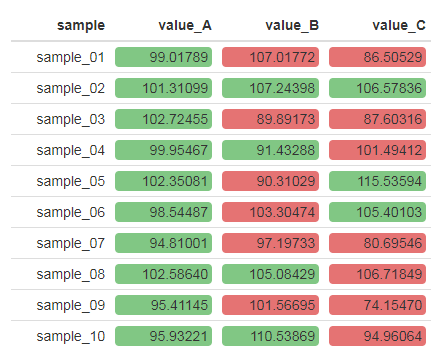
table of data color-coded according to RSDs
Code
 1library(dplyr)
 2library(tidyr)
 3library(formattable)
 4
 5## generate some dummy data
 6
 7df_dummy <- data.frame(sample = rep(sprintf('sample_%02i', 1:10), 4),
 8                       value_A = rnorm(40, 100, 5),
 9                       value_B = rnorm(40, 100, 15),
10                       value_C = rnorm(40, 100, 25),
11                       stringsAsFactors = FALSE)
12
13## calculate stats
14
15df_stats <- df_dummy %>%
16  gather(ref, value, -sample) %>%
17  group_by(sample, ref) %>%
18  summarise(avg = mean(value),
19            stdev = sd(value)) %>%
20  mutate(rsd = stdev / avg)
21
22## pull out a table of average results
23
24df_avg <- df_stats %>%
25  select(sample, ref, avg) %>%
26  spread(ref, avg)
27
28## pull out a table of RSDs
29
30df_rsd <- df_stats %>%
31  select(sample, ref, rsd) %>%
32  spread(ref, rsd)
33
34## create a series of formatters, one for each data column
35
36fmt <- lapply(1:(ncol(df_rsd)-1), function(y) {
37  d <- df_rsd[[y + 1]]
38  colors <- sapply(d, function(x) ifelse(x <= 0.15, '#81C784', '#e57373'))
39
40  formatter("span",
41            style = style(display = 'block',
42                          padding = '0 4px',
43                          `border-radius` = '4px',
44                          `background-color` = colors))
45})
46
47## name list items
48
49l.fmt <- setNames(lapply(1:(ncol(df_avg)-1), function(x) fmt[[x]]), names(df_avg)[2:ncol(df_avg)])
50
51## create table
52
53formattable(df_avg, l.fmt)